Overview
Online tracking on top 50 site home pages for France, Germany and United Kingdom
Data are collected using OpenWPM (laptop data) or Firefox for Android / mitmproxy (mobile data) and filtered with EasyList and EasyPrivacy.
"Data Connection Score" is weighted on cumulated tracker number associated with an organization. See Methods for more details.
Laptop data
| Country | Data Connection Score |
|---|---|
| France (FR) |  (3.523) (3.523) |
| Germany (DE) | (4.0) |
| United Kingdom (GB) | (3.529) |
Mobile data
| Country | Data Connection Score |
|---|---|
| France (FR) |  (3.199) (3.199) |
| Germany (DE) | (4.0) |
| United Kingdom (GB) | (3.192) |
Methods
Data Collection
For each Alexa top-50 site we visit, we identify other requested domains which we filter with sets of rules defined by EasyList and EasyPrivacy. When a domain is blocked by a rule, we consider it as a tracker and register it with the corresponding organization name. A list matching domain names with organization names supports this registration. We build and update this list requesting a whois server from a script or searching manually through the web if the information is missing.
Data aggregations
Two types of data aggregations are then performed: site-based or organization-based.
The site-based aggregation enables to present the number of different tracker domains requested when connecting to a site.
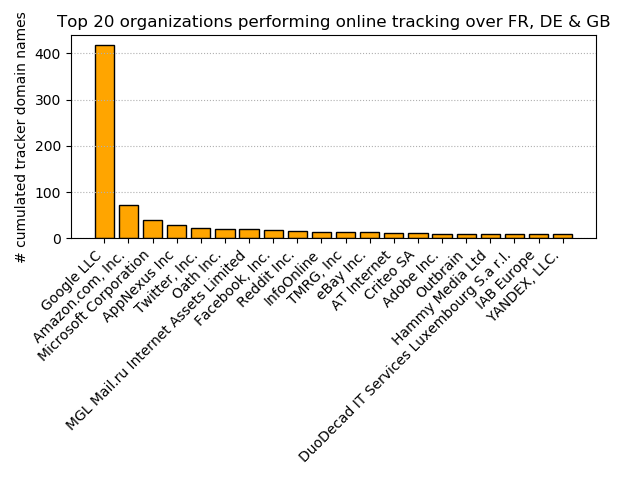
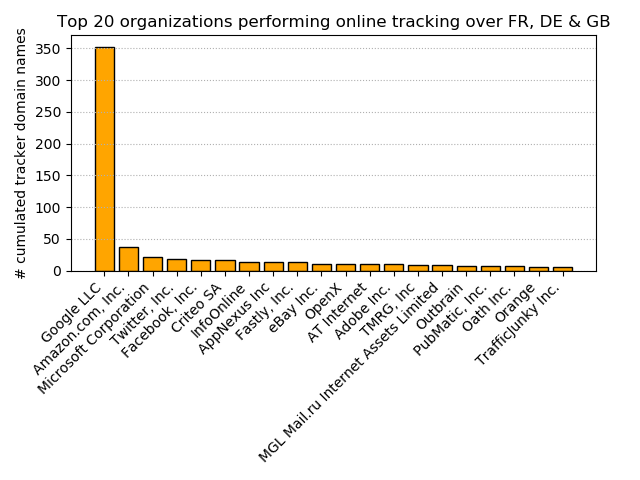
The organization-based aggregation enables to present the top-50 site cumulated number of tracker domains requested per tracking organization.
Data Connection Score
We define a numerical value \(V_s\) for a site \(s\) with \(n\) tracker domains and, for each tracking organization \(i\) linked to a tracker domain, \(N_i\) the top-50 site cumulated number of tracker domains requested:
By convention, the Data Connection Score (DCS) is defined over an interval:
Therefore, the DCS for a site, \(DCS_s\), is computed from \(V_s\) as follows:
\(DCS_s\) is afterwards rounded to the nearest integer to assign a label to the corresponding site inspired by the Nutri-score.
When scoring countries instead of sites, we perform an organization-based data aggregation over all countries and extend our previous approach to all countries.
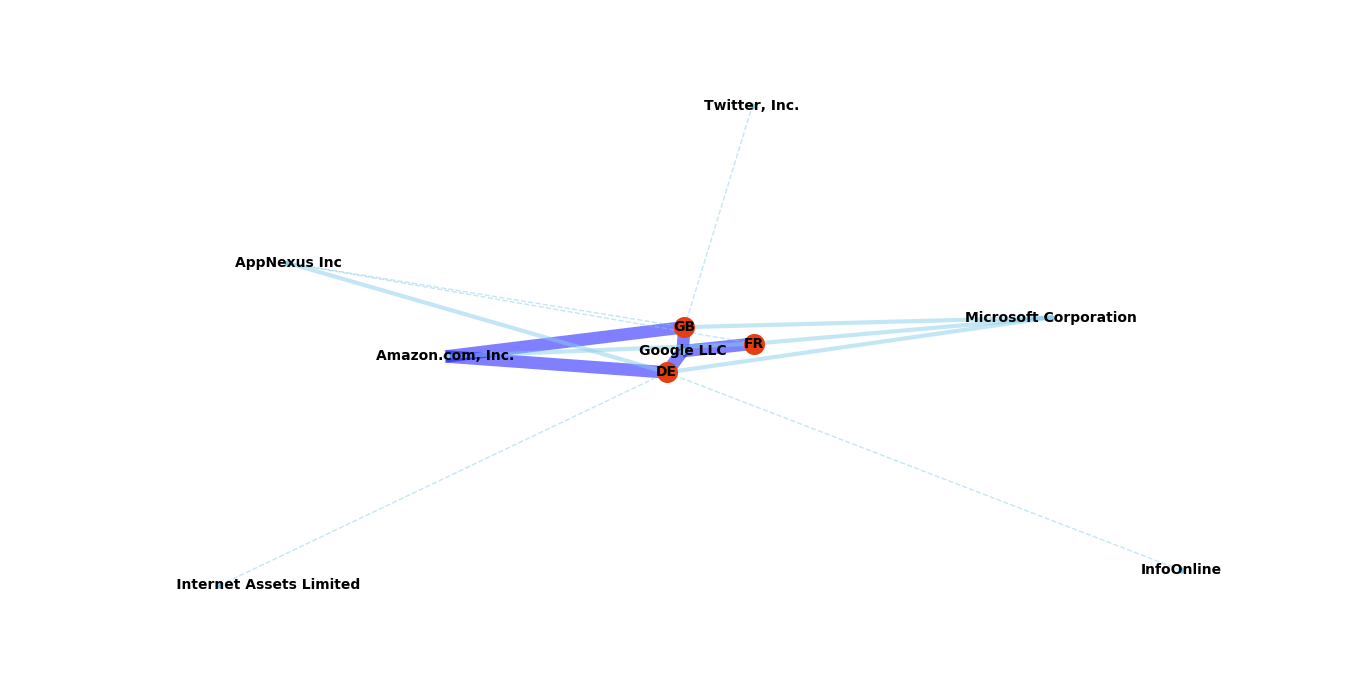
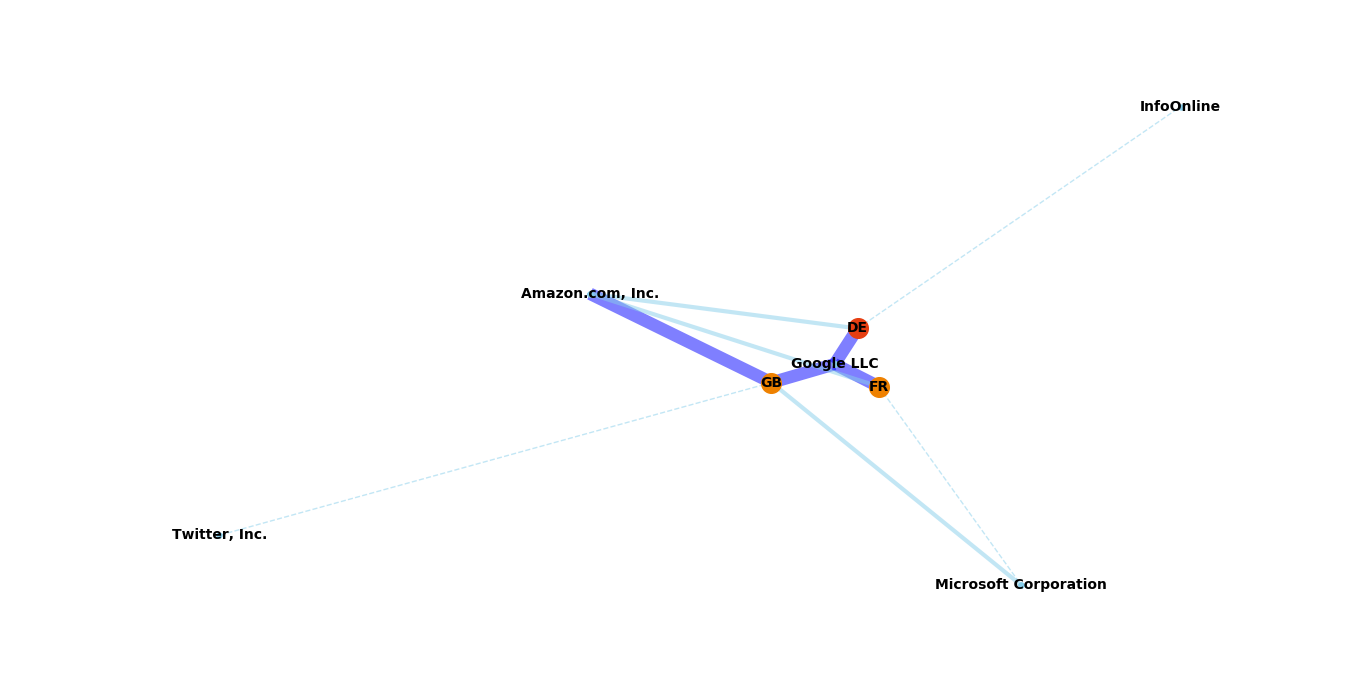
Network graphs
We consider site main connections in terms of number of connections to a tracking organization weighted by its top-50 site cumulated number of tracker domains requested. We only display from 85 to 100 percentile ranks of the distribution of these values as network graphs (< 90 as dashed skyblue, < 95 as skyblue and >= 95 as blue).
For switching to countries, as for Data Connection Score, we perform an organization-based data aggregation over all countries and extend our previous approach to all countries. In this case, we only display from 94 to 100 percentile ranks of these values as network graphs (< 96 as dashed skyblue, < 98 as skyblue and >= 98 as blue).